Analytics
Cross-job hiring health in one dashboard — applications, funnel conversion, portal traffic and team outcomes, always up to date.
Open the Analytics dashboard
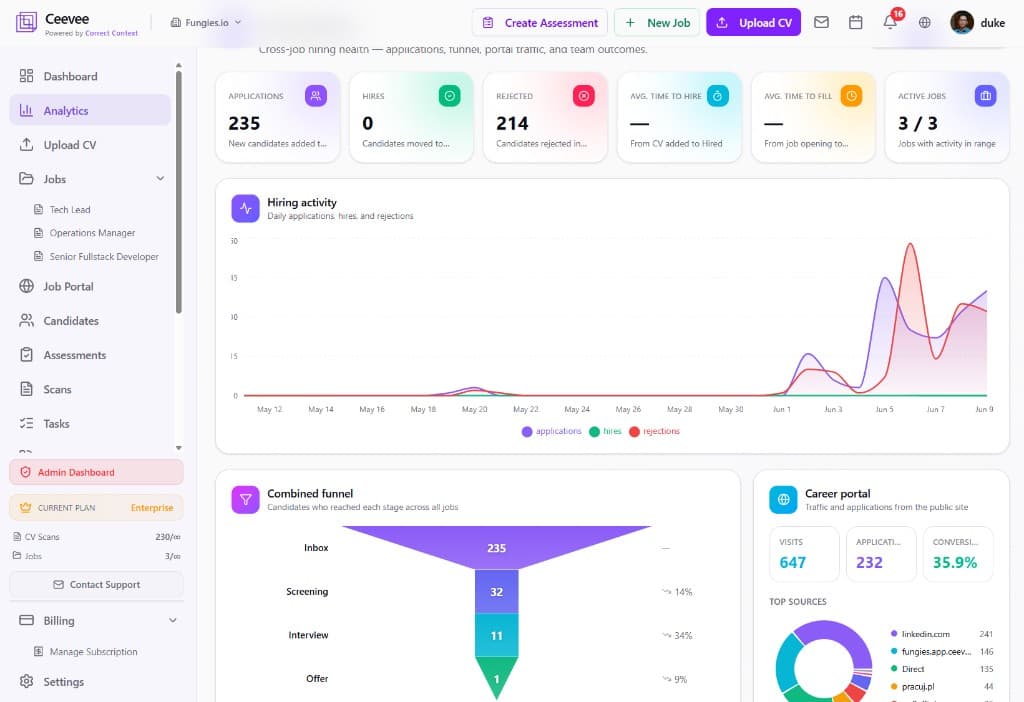
Click Analytics in the sidebar. Headline KPI cards show Applications, Hires, Rejected, Average time to hire, Average time to fill, and Active jobs for the selected date range.
Track hiring activity over time
The Hiring Activity chart plots daily applications, hires and rejections so you can spot spikes — like the surge after publishing a new role — and quiet weeks at a glance.
Analyze the combined funnel
The Combined Funnel shows how many candidates reached each stage across all jobs — Inbox, Screening, Interview, Offer — with stage-to-stage conversion percentages, so you know exactly where candidates drop off.
Measure your career portal
The Career Portal panel tracks Visits, Applications and Conversion rate from your public job portal, with a Top Sources breakdown (LinkedIn, your portal, direct, job boards) so you know which channels actually deliver candidates.
Drill into a single job
Every job also has its own analytics page — open a role and click Analytics to see the same charts scoped to that position only.